Resilience and the City
Good street design can improve our health
With lockdown came an increased awareness of how the design of our locales affects our health. A team from The Bartlett, already researching the impact of street design on our health, decided to catalogue and map out its impact.
It is widely accepted that the characteristics of the spaces where our daily lives take place influence how we live, move and interact with one another. However, the restrictions and increased time spent at home because of Covid-19 has sharpened our awareness of these issues and how critical they are to our overall wellbeing. It also gave an extra impetus to our study of this important field at The Bartlett. Significant research has been carried out in relation to physical health, particularly how urban and transport environments shape physical activity levels by prioritising motorised modes to the detriment of active modes such as walking and cycling. This research needs to be translated into usable information and tools for practitioners, which is what we have tried to do after the last year.
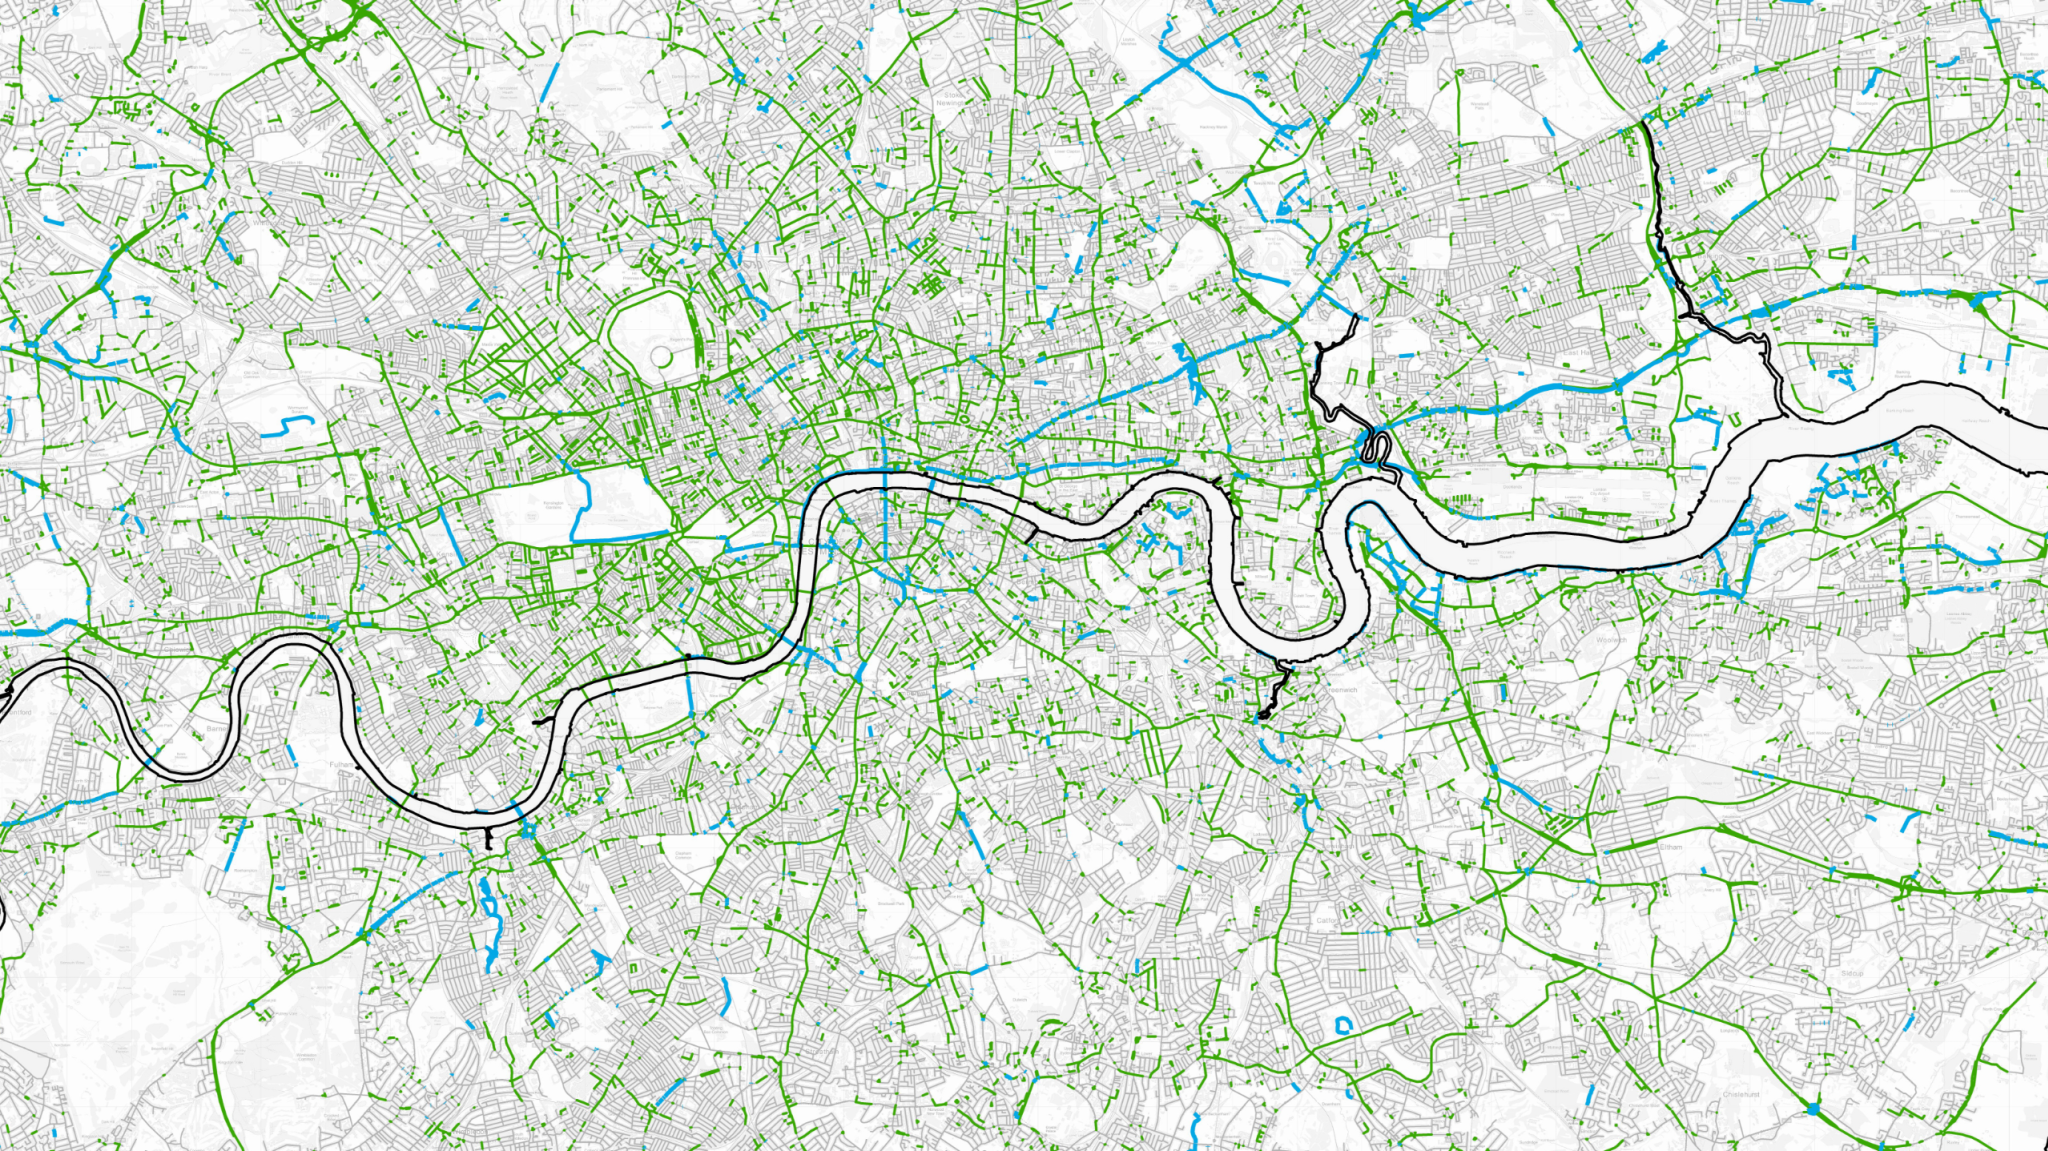
Above: All the streets shown in green have enough space on both sides for protected cycle lanes of 2.2m. Blue streets already have protected cycle lanes.
Prior to the pandemic, we had already developed the pedestrian demand model for the UK. This analytical tool uses built environment variables to predict average annual relative pedestrian activity for the whole country. This can and has been used nationally as the basis for developing walking infrastructure networks that connect the areas where most walking takes place with infrastructure that meets basic needs.
This includes high-quality, wide, continuous footways and frequent, safe crossing points, alongside public transport access points and cycling infrastructure. Whilst walking may seem prosaic, in London 24% of all travel time is spent on foot, the highest overall share of any mode, yet the idea of planning infrastructure networks for pedestrians is not widely applied or even understood. Equally important is how walking is the mode which provides opportunities to interact with people who we share the space with.
When the Covid-19 pandemic began, we were already collaborating with Nicolas Palominos from The Bartlett Centre of Adavanced Spatial Analysis as well as the companies Healthy Streets and Tranquil City to develop the Healthy Streets Index, combining multiple indicators to create an index that captures how healthy each street is from the perspective of a person travelling along or living on it. However, the pandemic and ensuing lockdown rapidly reshaped our daily activity patterns leading to the urgent need to understand if street space and infrastructure provided the necessary capacity for walking and cycling safely.
We released analysis for London in early May 2020 showing where pavement space provided sufficient space for social distancing, this found only 36% of pavements in London were at least three metres wide. This percentage fell even further in residential areas where people walked most during lockdown periods. This showed more needs to be done to provide the fundamental urban infrastructure for walking.
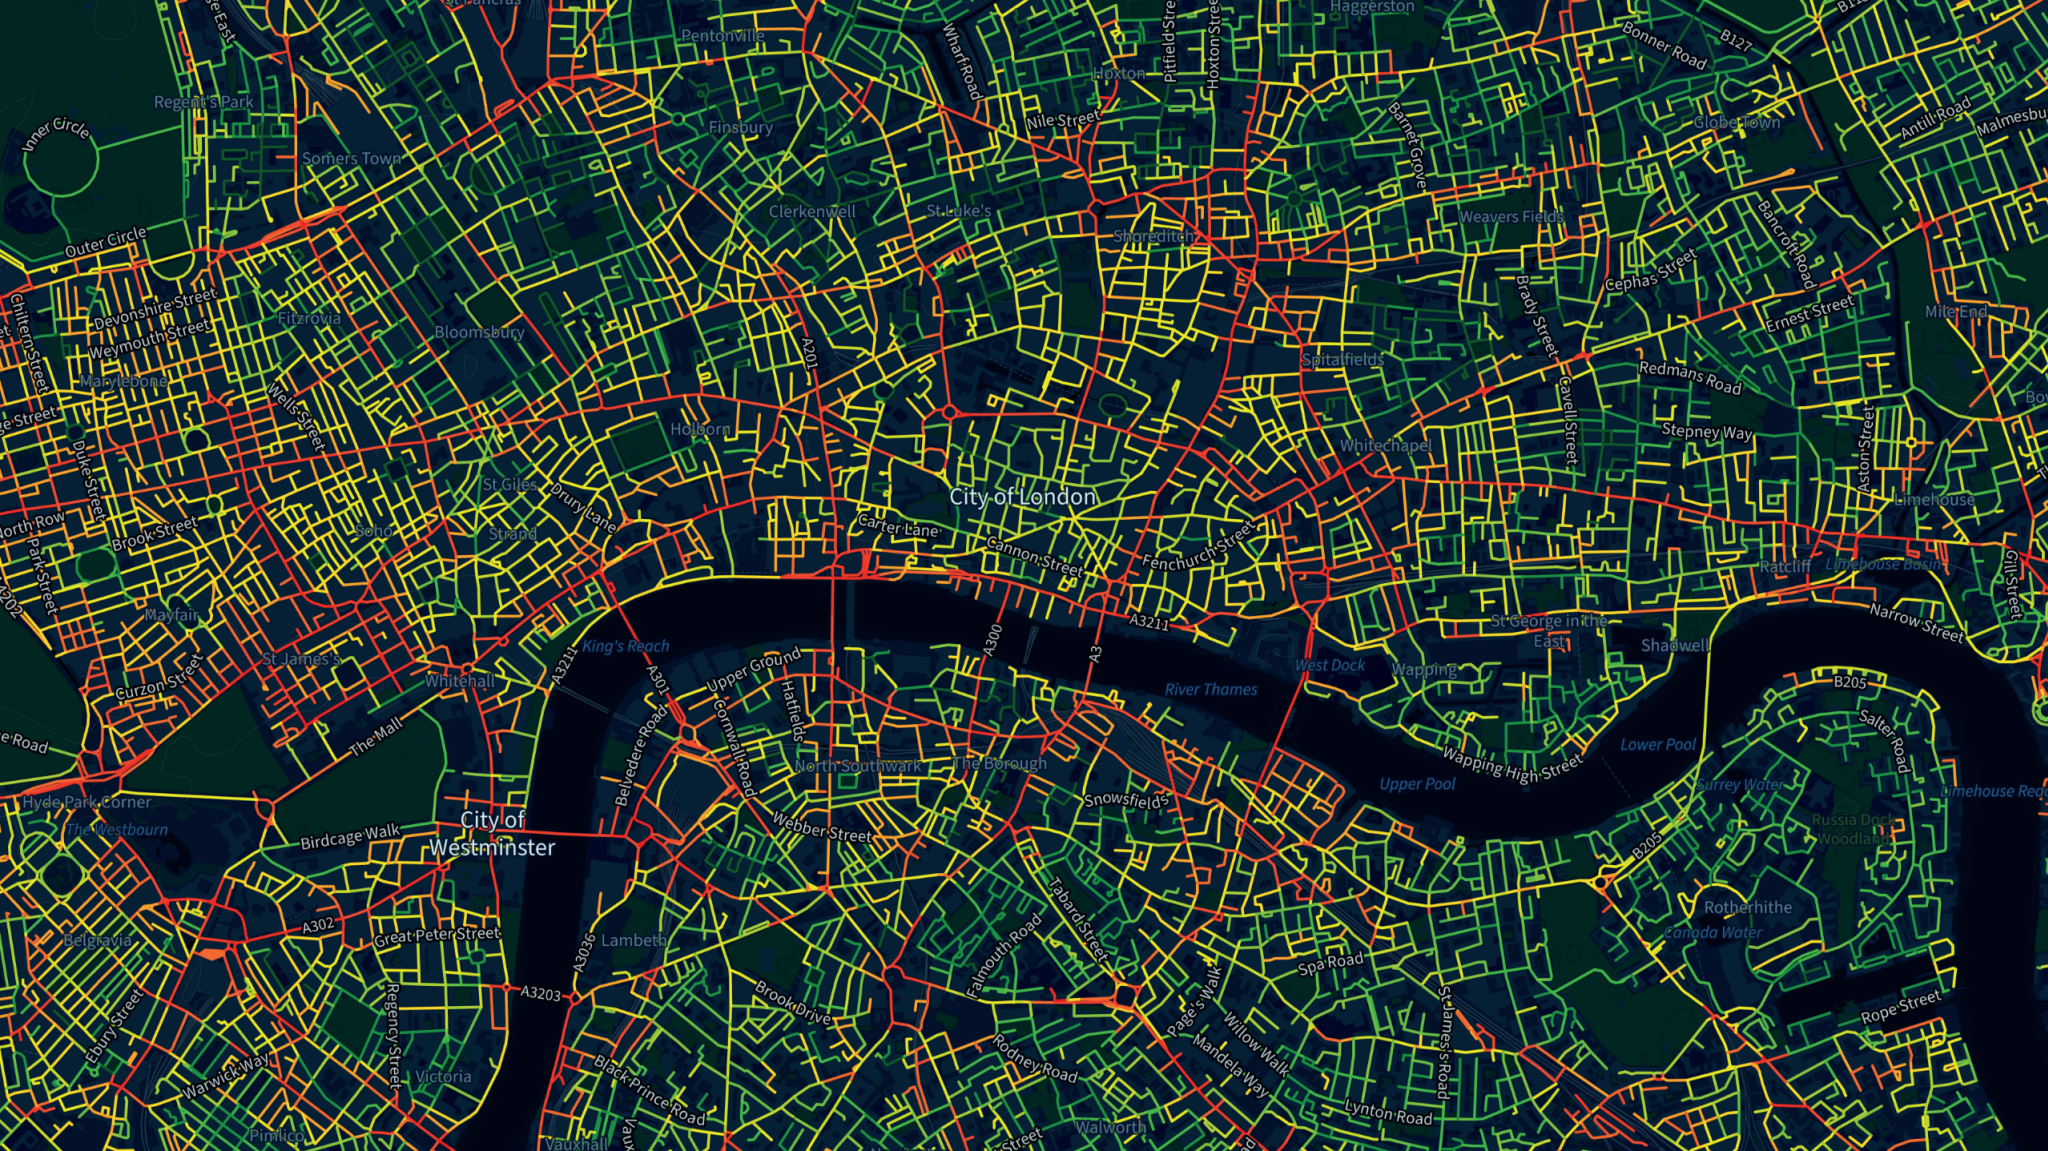
Above: The index rates streets based on the factors with the biggest impact on health, including pollution, design, accessibility and trees. Red notes the lowest score and green the highest.
In addition to this we released analysis in June 2020 showing that 2,357 km of additional protected cycle lanes could be accommodated on London’s street network. Both these pieces of work directly relate to health outcomes in terms of enabling physical activity as well as reducing emissions from cars if people feel they can switch to walking or cycling, in addition to the need for adapting how we travelled due to Covid-19.
We released the Healthy Streets Index in January 2021, following this research. The Index brought together all our expertise and created a holistic view of how a healthy street might be constituted: both in terms of their direct impacts, in terms of noise and air pollution but also their indirect impacts such as access to services and public transport. This index provides for the first time a combined, integrated rating of street environments from the perspective of human health. This allows individuals to understand how healthy their street is, planners to recognise where interventions might be needed to improve health outcomes and developers to plan built environments that maximise positive health impacts.
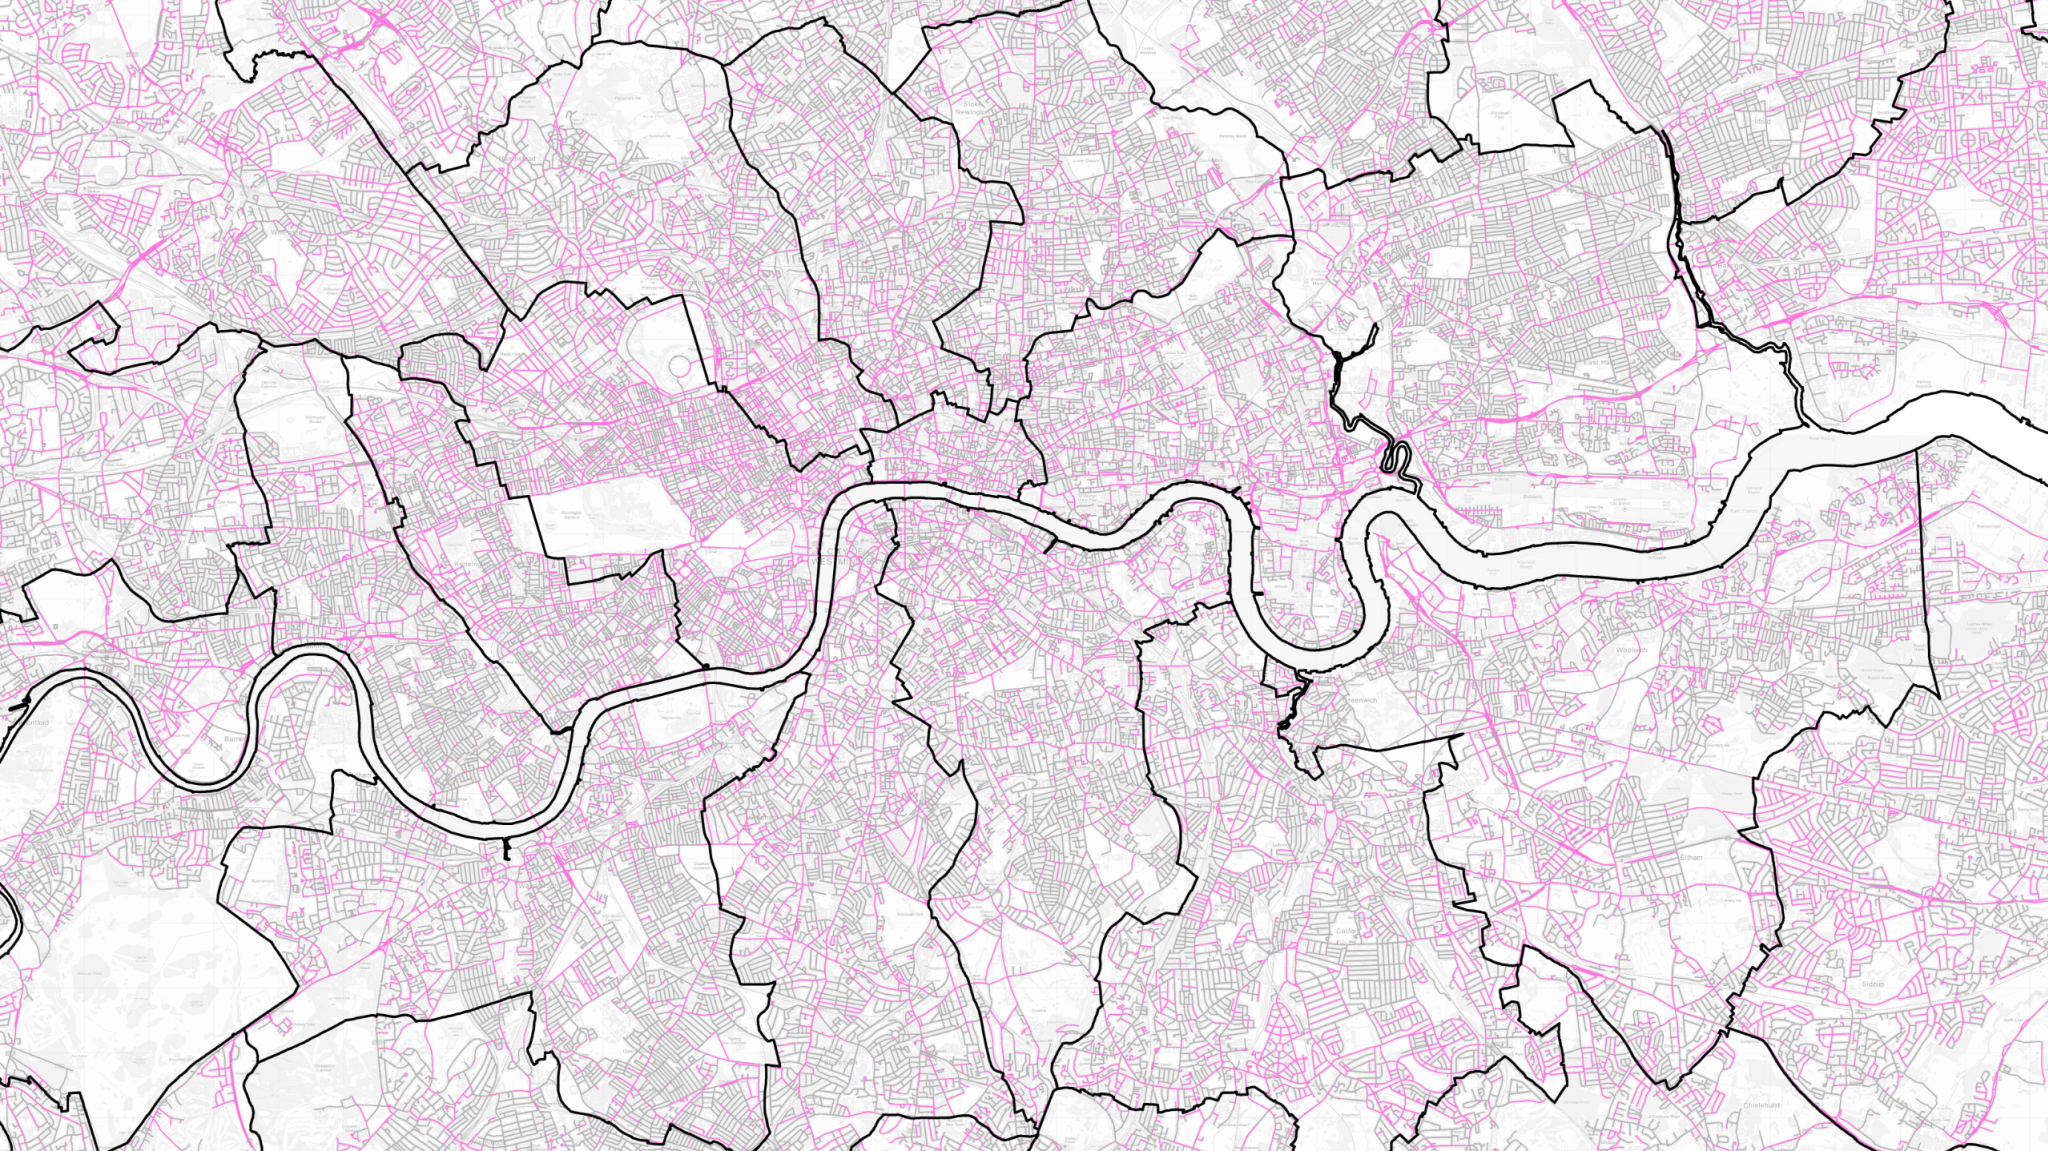
Above: All the streets shown in pink have 6 metres or more total non-road space. These streets on average have enough space on both sides for people walking to stay 2 metres apart.

A model of London’s relative average annual pedestrian activity. The peaks are areas of most intense pedestrian activity, whilst the troughs are the areas of lowest pedestrian activity.
All this work focuses primarily on physical health, but the next frontier in urban design and planning is designing for mental health – an equally important dimension to our wellbeing that was starkly demonstrated during the Covid-19. This is an emerging area of research that is even more challenging than physical health due to the complexities in data collection and establishing the link between mental health outcomes and the characteristics of the built environment.
This research is only just starting but we hope to have the first findings in 2022, which will then be used in similar ways to develop tools and indicators that can be used by both the public and professionals to understand and design streets and environments that minimise the negative impacts and maximise the positive impacts of our environments on our mental health. Bringing together both physical and mental health analytical approaches in to the design and planning of our streets and urban environments is urgently needed and something that is now finally on the horizon.